Forecast Data
This page provides information about the content of each individual forecast data package.
Further information can be found in the following places:
- Specific package content can be found on this page. Please refer to the navigation on the right
- Package output parameters can be found on the overview page
- Information about Weather Variables can be found on the Weather Variables page
General Packages
Basic
The basic package contains the most common weather variables. Despite the name, the basic package uses state of the art forecast technologies like mLM and nowcasting with real time corrections from nearby weather station and satellite and radar observations. Data are constantly updated to improve forecast quality.
Example URL: https://my.meteoblue.com/packages/basic-1h_basic-day?lat=47.558&lon=7.573&apikey=DEMOKEY
The basic package offers a 7 day forecast of precipitation, temperature, weather condition, wind speed & direction, humidity, sea level pressure, predictability and uv-index.
The 7 day weather forecast on the meteoblue website uses the basic package to display daily and 3-hourly data. Data on the website and in the API is identical.
Temperature
The temperature field is based on the mLM temperature forecast and is equivalent to a measurement 2 meters above ground. For complex terrain in the Alps and central Europe, meteoblue calculates specialized 700 m resolution domains to capture the precise local temperature. Thus changing the elevation can significantly change also the shape of the temperature curve, e.g. on a mountain peak, the diurnal variations seen in the valley can disappear almost completely. Outside Central Europe simpler elevation corrections are applied to account for the elevation difference between model topography and real topography. The elevation of the local topography at a given place is automatically determined using an 80m resolution digital elevation model, but it can also be specified manually with the &asl= URL parameter as described here.
If measurements from a nearby weather station are available, the temperature forecast is optimized for this station. Whether or not a station is used can be seen in the current package. Per default degree Celsius is used, but Fahrenheit can be selected with the temperature unit URL parameter.
The height of 2 meters above ground is most commonly used. Temperature forecasts for surface and in the soil are part of the agro package.
The 2 meter temperature might not represent the the perceived temperature. High humidity, strong winds and intense radiation increase or decrease the felt temperature. The felttemperature, tries to combine these factors.
For daily aggregations the minimum, mean and maximum is used. For 3 hourly values the values represents the reading at that point on time. It is not an average over 3 hours.
Precipitation
The precipitation field is the amount of all types of precipitation like rain, snow, ice, hail and convective showers. The field convective_precipitation only includes showers. Both fields must not be summed up. Precipitation is expressed as mm or inch depending on the precipitation amount unit parameter.
To calculate the amount of snow fall, the snowfraction field can be multiplied with the precipitation field. This snow fall amount in mm can be multiplied with 7 to get the equivalent snow depth. Example 1 mm precipitation is approximately equivalent to 7 mm snow fall. On some days there might be mixed conditions with rain and snow fall.
The precipitation in the basic package is calculated using multiple models with the meteoblue mLM technology. It is corrected using radar observations for the previous hours and the next 2 hours with a radar nowcasting. This correction applies to hourly data as well as daily aggregations.
For one and 3-hourly data, the precipitation value is the total amount of the preceding time-interval, similar to a rain gauge measurement. Example: For 3 hour data the precipitation at 12:00 is the sum of precipitation from 9:00 until 12:00. This is often misinterpreted by users. With 1-hourly precipitation this issue still exists, but is less noticeable.
To visualize the precipitation in the surroundings, the basic data package offers a rainspot to display rain in a 7x7 grid. Additional information is available here.
A more general description for precipitation amounts and probability can be found here.
rainSPOT
The rainSPOT represents the precipitation distribution around the chosen location. It is a 7x7 array encoded from south to north, west to east: 0000000000000011990009990000990000099000000000000
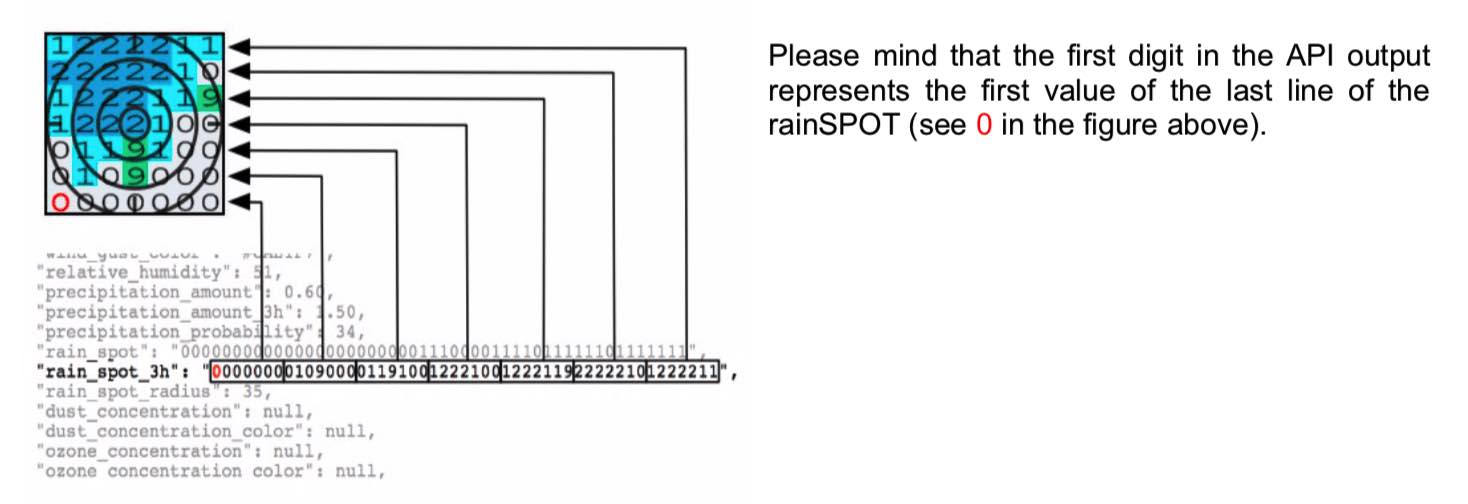
0 = no rain, 1 = light rain (0.2 – 1.5 mm), 2 = medium (1.5 – 5 mm), 3 = heavy (>5 mm), 9 = shower (0.02 – 0.2 mm)
Please mind that the first digit in the API output represents the bottom left cell in the rainSPOT (see red 0 in the figure above).
Weather Condition Pictogram
To classify weather conditions "sunny", "partly cloudy" or "overcast with rain" the pictocode field uses a numeric number. It is very important to note, that hourly pictograms and daily pictograms use different numeric codes. The basic package uses hourly pictogram codes from 1-35 and daily pictogram code from 1-17.
The field isdaylight can be used to switch between daylight and night-time pictograms.
3-hourly Pictograms use the same numeric code as 1-hourly pictograms. 6-hourly pictograms use the same numeric code as daily pictograms. The 12:00 3h-hourly pictogram represents the weather conditions from 09:00 to 12:00. Additional information is available here.
Wind Speed and Direction
Wind speed forecasts are also based on mLM and should be equivalent to a measurement on 10 meters above ground. Winds closer to the ground are usually slower. To obtain wind speed at 2 meters, multiply the 10 m wind speed by a factor of 0.74, which gives a very good agreement on average. Per default kilometers per hour are used. A different unit can be selected with the wind speed unit URL parameter.
Wind speeds tend to fluctuate to a certain degree within one hour as well as within one grid-cell. The hourly wind speeds are an average over 1 hour and in one grid-cell. Wind gusts can therefore be significantly higher. The wind package provides wind speeds at 80 meters as well as wind gusts.
Wind forecasts may not capture the precise local wind conditions which are influenced by terrain, vegetation or buildings.
Wind direction is indicated in degrees (0° north, 90° east, 180° south, 270° west). It is the direction the wind is coming from. For daily aggregations the dominant wind direction is calculated which accounts for the wind speeds of each direction.
Additional information about wind is available here.
Predictability
A single weather forecasts model cannot be optimized for all weather conditions and areas. meteoblue operates a large number of weather models and collects data from multiple national weather services. Some models are more suitable for complex alpine terrain, while other models calculate fog conditions more precise. By combining multiple forecast models with statistics and machine learning algorithms, meteoblue calculates a learning multi-model forecasts (mLM). A byproduct of this approach is the ability to estimate the accuracy of the current forecast for each location.
If the majority of forecast models predicts the same weather conditions for a given location and achieve consensus, a high predictability is indicated. The predictability is given in percent, as well as a predictability_class which is just a simpler representation for the percentage value.
Package Content
| Variable | Units | Description | Intervals | Aggregations (6h, day) |
|---|---|---|---|---|
| Precipitation* | mm, inch | Water amount | 5, 10, 15, 20, 30 mins, 1h, 3h, 6h, day | Sum |
| Precipitation probability | % | Likelihood of precipitation actually occurring | 1h, 3h, 6h, day | |
| Precipitation hours | h | Hours with precipitation | day | |
| Convective precipitation* | mm, inch | Water amount, caused by convection e.g. thunderstorms | 1h, 3h, 6h, day | Sum |
| Snow fraction | 0, 1 | information whether precipitation falls as rain or snow: 0 = rain, 1 = snow | 1h, 3h, 6h, day | Aggregations: range from 0 till 1 (mean of hourly values) |
| Temperature | °C, °F | 2m above ground | 5, 10, 15, 20, 30 mins, 1h, 3h, 6h, day | Min, max, mean |
| Felt temperature | °C, °F | 2m above ground | 5, 10, 15, 20, 30 mins, 1h, 3h, 6h, day | Min, max |
| Temperature instant | °C, °F | Temperature at 00:00 O'clock | day | |
| Index to 1h values | Index | Corresponding hourly Index to daily values | day | start, end |
| Pictocode | 1 - 35, 1 - 17 | 1h & 3h: 1 - 35 day/night pictos, 6h & day: 1 - 17 iday pictos | 1h, 3h, 6h, day | |
| Wind speed | m/s, km/h, kn, mph, bf | 10m above ground | 5, 10, 15, 20, 30 mins,1h, 3h, 6h, day | Min, max, mean |
| Wind direction | °, 2 char, 3 char | 10m above ground | 5, 10, 15, 20, 30 mins, 1h, 3h, 6h, day | Dominant |
| Relative humidity | % | Air humidity | 5, 10, 15, 20, 30 mins, 1h, 3h, 6h, day | Min, max, mean |
| RH > 90% | h | day | ||
| Sea level pressure | hPa | Adjusted to mean sea level | 5, 10, 15, 20, 30 mins, 1h, 3h, 6h, day | Min, max, mean |
| rainSPOT | 0, 1, 2, 3, 9 | 0 ≤ 0.02 mm, 1 = 0.2 - 1.5 mm, 2 = 1.5 - 5 mm, 3 ≥ 5 mm, 9 = 0.02 - 0.2 mm | 1h, 3h, 6h, day | |
| Predictability | % | 24h | day | |
| Predictability class | 0 - 5 | 1 = very low, 5 = very high | day | |
| UV-index | 0 - 11+ | Ground level | day | |
| Is-daylight | 0, 1 | 1 = day, 0 = night | 1h, 3h |
*Precipitation is the total amount: Do not compute the sum of precipitation and convective precipitation.
Current
The Current data package contains current weather information, including observations and measurements. It returns current temperature, windspeed and condition measurement. It is not based on a single measurement, but combined from multiple weather stations using downscaling and interpolation algorithms. Current satellite and radar telemetry is used to adapt the weather condition pictogram. In case no weather station is nearby, a weather forecast model will be used.
Example URL: https://my.meteoblue.com/packages/current?lat=47.558&lon=7.573&apikey=DEMOKEY
Package Content
| Variable | Units | Description |
|---|---|---|
| Pictocode | 1 - 17 | 1 - 17, iday pictos (6h & day data) |
| Pictocode detailed | 1 - 35 | 1 - 35, day/night pictos (1h & 3h data) |
| Temperature | °C, °F | 2m above ground, Temperature for indicated time |
| Wind speed | m/s, km/h, kn, mph, bf | 10m above ground, Wind speed for indicated time |
| Is-daylight | 1 = day, 0 = night | |
| Is-observation | 1 = obs available, 0 = no obs | |
| Zenith angle | ° | Angle between zenith and centre of the sun's disc |
| Metar ID | Identification Nr. of the Metar Station which provides the data |
Clouds
The Clouds data package contains detailed cloud layer and sunshine duration forecasts.
Example URL: https://my.meteoblue.com/packages/clouds-1h_clouds-day?lat=47.558&lon=7.573&apikey=DEMOKEY
Package Content
| Variable | Units | Description | Intervals | Aggregations (6h, day) |
|---|---|---|---|---|
| Low clouds | % | Cover of the sky | 5, 10, 15, 20, 30 mins, 1h, 3h, 6h, day | Min, max, mean |
| Mid clouds | % | Cover of the sky | 5, 10, 15, 20, 30 mins, 1h, 3h, 6h, day | Min, max, mean |
| High clouds | % | Cover of the sky | 5, 10, 15, 20, 30 mins, 1h, 3h, 6h, day | Min, max, mean |
| Total cloud cover | % | Cover of the sky | 5, 10, 15, 20, 30 mins, 1h, 3h, 6h, day | Min, max, mean |
| Visibility | m | Distance | 5, 10, 15, 20, 30 mins, 1h, 3h, 6h, day | Min, max, mean |
| Sunshine Time | min/h | Direct sunlight, depends also on day length | 5, 10, 15, 20, 30 mins, 1h, 3h, 6h, day | Min/interval |
| Fog Probability | % | The likelihood of fog to occur in the defined time and area | 5, 10, 15, 20, 30 mins, 1h, 3h, 6h, day | Min, max, mean |
| Index to 1h values | Index | Corresponding hourly Index to daily values | day | start, end |
Sun and Moon
The Sun and Moon data package contains information about rising and setting times of sun and moon. Rise and set times are indicated as string “hh:mm”. There are two special cases: If the moon does not rise and/or not set the field will have the value "---". If the moon is shining the entire day, then moonrise will be set to “00:00” and moonset will be “24:00”. The same applies if the sun does not rise and/or set, this time for the suns fields.
Example URL: https://my.meteoblue.com/packages/sunmoon?lat=47.558&lon=7.573&apikey=DEMOKEY
Package Content
| Variable | Units | Description | Intervals |
|---|---|---|---|
| Sunrise and sunset time | hh:mm | day | |
| Moon rise and moon set time | hh:mm | day | |
| Moon phase angle | degree | day | |
| Moon age | days | day | |
| Moon phase name | name | New, waxing crescent, first quarter, waxing gibbous, full, waning gibbous, last quarter, waning crescent | day |
| Moon phase transit time | hh:mm | day | |
| Moon illuminated fraction | % | The portion of the moon that is illuminated by the sun | day |
Moonlight
The moonlight package contains parameters for assessing night sky conditions, providing information about the brightness of the sky under clear and actual conditions, the impact of moonlight, and the zenith angle.
Example URL: https://my.meteoblue.com/packages/moonlight-1h?lat=45&lon=5&apikey=DEMOKEY
Package Content
| Variable | Units | Description | Intervals |
|---|---|---|---|
| Moonlight clear sky | % | Percentage of light w.r.t. luminance of full moon at average distance not considering cloud-cover | 5, 10, 15, 20, 30 mins, 1h |
| Moonlight actual | % | Percentage of light w.r.t. luminance of full moon at average distance considering cloud-cover | 5, 10, 15, 20, 30 mins, 1h |
| Nightsky brightness clear sky | lx | Illuminance of the nightsky in lux not considering cloud-cover | 5, 10, 15, 20, 30 mins, 1h |
| Nightsky brightness actual | lx | Illuminance of the nightsky in lux considering cloud-cover | 5, 10, 15, 20, 30 mins, 1h |
| Zenith angle | ° | Solar zenith angle, important for twilight estimates | 5, 10, 15, 20, 30 mins, 1h |
Web Colors
The Web Colors package contains the meteoblue HTML colour codes for web-formatting. For plotting numbers on the indicated colours, use the font-colour specified in the package.
Note: This package is only available in combination with a data package.
Example URL: https://my.meteoblue.com/packages/basic-day_webcolors?lat=47.558&lon=7.573&apikey=DEMOKEY
Package Content
| Variable | Units |
|---|---|
| Temperature | °C, °F |
| Felt temperature | °C, °F |
| Wind speed | m/s, km/h, kn, mph, bf |
| UV-Index | 1 - 11+ |
| Predictability | % |
Agronomical Packages
Agro
The Agro data package serves agricultural purposes and contains soil and vegetation related weather variables.
Example URL: https://my.meteoblue.com/packages/agro-1h_agro-day?lat=47.558&lon=7.573&apikey=DEMOKEY
Package Content
| Variable | Units | Description | Intervals | Aggregations (6h, day) |
|---|---|---|---|---|
| Skin / Surface temperature | °C, °F | Soil surface or skin | 1h, 3h, 6h, day | Min, max, mean |
| Wetbulb temperature | °C, °F | 1h, 3h, 6h, day | Min, max, mean | |
| Total evapotranspiration* | mm | 1h, 3h, 6h, day | Sum | |
| Potential evapotranspiration* | mm | Assuming unlimited water supply | 1h, 3h, 6h, day | Sum |
| Reference evapotranspiration* (ET_0) | mm | 1h, 3h, 6h, day | sum | |
| Leaf wetness index | 0, 1 | Dew on leaves | 1h, 3h, 6h, day | Mean |
| Soil temperature (0 - 10cm) | °C, °F | 1h, 3h, 6h, day | Min, max, mean | |
| Soil moisture (0 - 10cm) | vol. % | 1h, 3h, 6h, day | Min, max, mean | |
| Dew point temperature | °C, °F | 2m above ground | 1h, 3h, 6h, day | Min, max, mean |
| Mean sensible heat flux | W/m | Mean energy flux of the surface energy balance which is used to heat(+) or cool(-) the air | 1h, 3h, 6h, day | Mean |
| Index to 1h values | Index | Corresponding hourly Index to daily values | day | start, end |
* For further information about the different evapotranspiration datasets, please consult the variable documentation.
Agromodel Leaf Wetness
The Agromodel Leaf Wetness data package contains all relevant information for monitoring and forecasting leaf wetness.
Example URL: https://my.meteoblue.com/packages/agromodelleafwetness-1h?lat=47.558&lon=7.573&apikey=DEMOKEY
Package Content
| Variable | Units | Description | Intervals |
|---|---|---|---|
| Leaf wetness probability | % | Probability of leaf wetness (0% = low probability, 100% = high probability) | 1h |
| Leaf wetness rain index | 0 - 1 | Index describing the contribution of rain to leaf wetness (0 = no contribution, 1 = maximal contribution) | 1h |
| Leaf wetness dew index | 0 - 1 | Index describing the contribution of dew to leaf wetness (0 = no contribution, 1 = maximal contribution) | 1h |
| Leaf wetness evaporation index | 0 - 1 | Index describing the contribution of evaporation to leaf wetness (0 = no contribution, 1 = maximal contribution) | 1h |
The indices have been designed to allow the professional user to calibrate each of the three elements influencing leaf wetness according to his local conditions, in order to compute a site specific leafwetness probability.
Agromodel Sowing
The Agromodel Sowing data package contains information about suitable time windows for sowing crops. Criteria used for sowing window:
- Minimum soil temperature during (but not beyond) the forecast period (usually, a 5-7-day period), depending on crop; minimas for Maize and sunflower = 8°C.
- Precipitation amount at and before the interval. Precipitation of more than 1 mm/hour will stop sowing for 12 hours after occurrence, or longer if evaporation rates are low.
The Agromodel Sowing data does not consider the following variables:
- Suitable sowing season, as it does not consider previous precipitation, accumulated soil moisture in deeper levels and subsequent length of growing season. For these assessments, historic seasonal diagrams are necessary (e.g. history+).
- Minimal soil moisture for germination, as this may vary substantially within few centimetres and by soil type, depends on the soil cover and planting method, and limit sowing periods unduly.
All variables use a recommendation classification from 0 to 2 (see below).
Example URL: https://my.meteoblue.com/packages/agromodelsowing-1h?lat=47.558&lon=7.573&apikey=DEMOKEY
Package Content
| Variable | Units* | Intervals |
|---|---|---|
| Sowing maize | 0, 1, 2 | 1h |
| Sowing wheat | 0, 1, 2 | 1h |
| Sowing barley | 0, 1, 2 | 1h |
| Sowing rapseed | 0, 1, 2 | 1h |
| Sowing potato | 0, 1, 2 | 1h |
| Sowing sugarbeets | 0, 1, 2 | 1h |
| Sowing soybean | 0, 1, 2 | 1h |
| Sowing cotton | 0, 1, 2 | 1h |
| Sowing riceindica | 0, 1, 2 | 1h |
| Sowing ricejaponi | 0, 1, 2 | 1h |
| Sowing sorghum | 0, 1, 2 | 1h |
Agromodel Spray
The Agromodel Spray data package contains information about suitable time windows for spraying fields.
The spraying conditions are calculated from the wind, precipitation, temperature and humidity forecasts. The recommendation must be verified just before the application with the current actual weather conditions.
All variables use a recommendation classification from 0 to 2 similar to the Agromodel Sowing package (see below).
Example URL: https://my.meteoblue.com/packages/agromodelspray-1h?lat=47.558&lon=7.573&apikey=DEMOKEY
Package Content
| Variable | Units* | Intervals |
|---|---|---|
| Spray window | 0, 1, 2 | 1h |
*Recommendation classifications:
| Class | Description |
|---|---|
| 0 | Suitable period for application (green) |
| 1 | Less suitable period for application (yellow) |
| 2 | Unsuitable period for application (red) |
Soil Trafficability
The Soil Trafficability data package contains information about the capacity of the soil to support moving vehicles based on the soil type and the development of water content in the top soil (0 - 10 cm).
Example URL: https://my.meteoblue.com/packages/soiltrafficability-1h?lat=47.558&lon=7.573&apikey=DEMOKEY
Package Content
| Variable | Units | Description | Intervals |
|---|---|---|---|
| Sand | 0 - 1 | Stability of the soil for moving vehicles (0 = no trafficability, 1 = good trafficability) | 1h |
| Silty Loam | 0 - 1 | Stability of the soil for moving vehicles (0 = no trafficability, 1 = good trafficability) | 1h |
| Silt | 0 - 1 | Stability of the soil for moving vehicles (0 = no trafficability, 1 = good trafficability) | 1h |
| Clay | 0 - 1 | Stability of the soil for moving vehicles (0 = no trafficability, 1 = good trafficability) | 1h |
Renewable Energy Packages
Solar
The Solar data package contains specific solar radiation variables for the solar energy sector.
Example URL: https://my.meteoblue.com/packages/solar-1h_solar-day?lat=47.558&lon=7.573&apikey=DEMOKEY
Package Content
| Variable | Units | Description | Intervals | Aggregations (6h, day) |
|---|---|---|---|---|
| GHI | W/m | Global horizontal radiation | 5, 10, 15, 20, 30 mins, 1h, 3h, 6h, day | Instant, Backwards (average of previous hour), Daily Sum |
| GNI | W/m | Global normalised radiation | 5, 10, 15, 20, 30 mins, 1h, 3h, 6h, day | Instant, Backwards (average of previous hour), Daily Sum |
| DIR | W/m | Direct horizontal radiation | 5, 10, 15, 20, 30 mins, 1h, 3h, 6h, day | Instant, Backwards (average of previous hour), Daily Sum |
| DNI | W/m | Direct normalised radiation | 5, 10, 15, 20, 30 mins, 1h, 3h, 6h, day | Instant, Backwards (average of previous hour), Daily Sum |
| DIF | W/m | Diffuse radiation | 5, 10, 15, 20, 30 mins, 1h, 3h, 6h, day | Instant, Backwards (average of previous hour), Daily Sum |
| Clear sky solar radiation | W/m | Clear sky solar radiation | 5, 10, 15, 20, 30 mins, 1h, 3h, 6h, day | Instant, Backwards (average of previous hour), Daily Sum |
| Extraterrestrial solar radiation | W/m | Extraterrestrial solar radiation | 5, 10, 15, 20, 30 mins, 1h, 3h, 6h, day | Instant, Backwards (average of previous hour), Daily Sum |
Solar Ensemble
The Solar Ensemble data package contains aggregated and individual members from the GFS ensemble solar forecasts. It consists of over 25 different forecasts and provides a long term estimate of expected conditions. meteoblue computes a most likely consensus forecast, the minimum and maximum, as well as the Percentiles exceedence values. The percentiles are computed directly from the data, not with any shortcuts assuming a gaussian distribution or standard deviations.
Example URL: https://my.meteoblue.com/packages/solarensemble-1h?lat=47.558&lon=7.573&apikey=DEMOKEY
Package Content
| Variable GHI | Units | Description | Intervals |
|---|---|---|---|
| GHI backwards consensus | W/m | 5, 10, 15, 20, 30 mins, 1h | |
| GHI backwards p90 exceedence | W/m | Available as p95, p90, p85, p80, p75, p70, p60, p50, p40, p30, p25, p20, p15, p10, p5 | 1h |
| Max GHI backwards | W/m | 5, 10, 15, 20, 30 mins, 1h | |
| Min GHI backwards | W/m | 5, 10, 15, 20, 30 mins, 1h |
Example: The P90_exceedence for GHI gives the global horizontal irradiation which is exceeded with 90% probability and thus is obviously much smaller than e.g. a P30_exceedence GHI, which is only reached with 30% probability.
Note: The distributions and weather uncertainty in the forecasts are using real probabilistics and are therefore not gaussian.
PV Pro
The PV Pro data package contains solar power production forecasts based on kilowatt peak as well as panel inclination and orientation.
Required Input Parameters
| Name | Description | Example | Default |
|---|---|---|---|
| kWp | Kilowatt peak production | &kwp=1 | null |
| Slope | Inclination of solar panel | &slope=20 | null |
| Facing | Orientation of solar panel | &facing=180 | null |
| Power efficiency | Power efficiency of pv module | &power_efficiency=0.9 | 0.85 |
| Tracker* | For solar panels using a sun tracker | &tracker=1 | null |
Package Content
| Variable | Units | Description | Intervals | Aggregations (day) |
|---|---|---|---|---|
| PV power | kWh, mW/h | Photovoltaic power | 5, 10 ,15, 20, 30 mins, 1h, day | Instant, Backwards (average of previous hour), Daily Sum |
| GTI | W/m | Global Tilted Irradiance (Radiation) | 5, 10, 15, 20, 30 mins, 1h, day | Instant, Backwards (average of previous hour), Daily Sum |
| Performance ratio | % | 5 ,6, 10, 15, 20, 30 mins, 1h | ||
| Module temperature | °C, °F | 5 ,6, 10, 15, 20, 30 mins, 1h, day | Instant, Backwards (average of previous hour), Daily Mean | |
| IAM | % | Incidence Angle Modifier | 5, 10, 15, 20, 30 mins, 1h | Instant, Backwards (average of previous hour) |
| Snow cover | cm | On the PV modules, Considers inclination | 5, 10, 15, 20, 30 mins, 1h, day | Mean |
| Index to 1h values | Index | Corresponding hourly Index to daily values | day | start, end |
Package Specific Output Parameters
| Output parameters | Units | Description |
|---|---|---|
| Facing | ° | Orientation of solar panel |
| kWp | kW | Peak capacity of solar system |
| Slope | ° | Inclination of solar panel |
| Tracker* | Mode | For solar panels using a sun tracker |
*Sun Tracker Definition
| Mode | Description |
|---|---|
| 1 | Daily vertical axis tracker |
| 2 | Daily 2-axis tracker |
| 3 | Yearly horizontal tracker |
| 4 | Daily DNI tracker |
| 5 | Daily horizontal axis tracker |
PV Ensemble
Required Input Parameters
| Name | Description | Example | Default |
|---|---|---|---|
| kWp | Kilowatt peak production | &kwp=1 | null |
| Slope | Inclination of solar panel | &slope=20 | null |
| Facing | Orientation of solar panel | &facing=180 | null |
| Power efficiency | Power efficiency of pv module | &power_efficiency=0.9 | 0.85 |
| Tracker* | For solar panels using a sun tracker | &tracker=1 | null |
Package Content
| Variable | Units | Description | Intervals |
|---|---|---|---|
| PV power backwards consensus | kW | 5, 10, 15, 20, 30 mins, 1h | |
| PV power backwards p90 exceedence | kW | Available as p95, p90, p85, p80, p75, p70, p60, p50, p40, p30, p25, p20, p15, p10, p5 | 5, 10, 15, 20, 30 mins, 1h |
| Max PV power backwards | kW | 5, 10, 15, 20, 30 mins, 1h | |
| Min PV power backwards | kW | 5, 10, 15, 20, 30 mins, 1h |
Package Specific Output Parameters
| Output parameters | Units | Description |
|---|---|---|
| Facing | ° | Orientation of solar panel |
| kWp | kW | Peak capacity of solar system |
| Slope | ° | Inclination of solar panel |
| Tracker* | Mode | For solar panels using a sun tracker |
*Sun Tracker Definition
| Mode | Description |
|---|---|
| 1 | Daily vertical axis tracker |
| 2 | Daily 2-axis tracker |
| 3 | Yearly horizontal tracker |
| 4 | Daily DNI tracker |
| 5 | Daily horizontal axis tracker |
Wind
The Wind data package contains specific wind variables for the wind energy sector.
Example URL: https://my.meteoblue.com/packages/wind-1h_wind-day?lat=47.558&lon=7.573&apikey=DEMOKEY
Package Content
| Variable | Units | Description | Intervals | Aggregations (6h, day) |
|---|---|---|---|---|
| Wind gusts | m/s, km/h, kn, mph, bf | 10m above ground | 5, 10, 15, 20, 30 mins, 1h, 3h, 6h, day | Min, max, mean |
| Wind direction 80m | °, 2 char, 3 char | 80m above ground | 5, 10, 15, 20, 30 mins, 1h, 3h, 6h, day | Dominant |
| Wind speed 80m | m/s, km/h, kn, mph, bf | 80m above ground | 5, 10, 15, 20, 30 mins, 1h, 3h, 6h, day | Min, max, mean |
| Air density | kg/m | As result of altitude, temperature and humidity | 5, 10, 15, 20, 30 mins, 1h, 3h, 6h, day | Min, max, mean |
| Air pressure | hPa | At surface height, not converted to sea level | 5, 10, 15, 20, 30 mins, 1h, 3h, 6h, day | Min, max, mean |
Wind 80m Ensemble
The Wind 80m Ensemble data package contains aggregated and individual members from the GFS ensemble wind forecasts. It consists of over 25 different forecasts and provides a long term estimate of expected conditions. meteoblue computes a most likely consensus forecast, the minimum and maximum, as well as the percentiles exceedence values. The percentiles are computed directly from the data, not with any shortcuts assuming a gaussian distribution or standard deviations.
Example URL: https://my.meteoblue.com/packages/wind80ensemble-1h?lat=47.558&lon=7.573&apikey=DEMOKEY
Package Content
| Variable GHI | Units | Description | Intervals |
|---|---|---|---|
| Wind speed 80m consensus | m/s, km/h, kn, mph, bf | 80m above ground | 5, 10, 15, 20, 30 mins, 1h |
| Wind speed 80m p90 exceedence | m/s, km/h, kn, mph, bf | Available as p95, p90, p85, p80, p75, p70, p60, p50, p40, p30, p25, p20, p15, p10, p5 | 5, 10, 15, 20, 30 mins, 1h |
| Max wind speed 80m | m/s, km/h, kn, mph, bf | 80m above ground | 5, 10, 15, 20, 30 mins, 1h |
| Min wind speed 80m | m/s, km/h, kn, mph, bf | 80m above ground | 5, 10, 15, 20, 30 mins, 1h |
Example: The P90_exceedence for wind speed gives the speed which is exceeded with 90% probability and thus is obviously much smaller than e.g. a P30_exceedence wind speed, which is only reached with 30% probability.
Note: The distributions and weather uncertainty in the forecasts are using real probabilistics and are therefore not gaussian.
Wind Power
The Wind Power data package contains wind power forecasts at a height of 80m.
Required Input Parameters
| Name | Description | Example | Default |
|---|---|---|---|
| Turbine ID | Turbine type | &turbineid=-1* | null |
| Power efficiency | Power efficiency of wind turbine | &power_efficiency=0.9 | 1 |
| Number of turbines | Number of turbines | &numberofturbines=10 | 1 |
| kWp** | Kilowatt peak production | &kwp=1 | 1 |
* You can find the list of the turbine IDs / types here.
** only applicable for standard turbine (turbineid=-1)
Package Content
| Variable | Units | Description | Intervals |
|---|---|---|---|
| Wind Power | kW | 80m above ground | 5, 10, 15, 20, 30 mins, 1h |
Package Specific Output Parameters
| Output parameters | Units | Description |
|---|---|---|
| Turbine Type | Type | Selected Turbine Type |
| kWp | kW | Peak capacity of wind turbine |
| Number of Turbines | # | Number of turbines |
| Forecast Type | - | RAW |
| Power efficiency | % | Power efficiency of wind turbine |
Wind Power Ensemble
Required Input Parameters
| Name | Description | Example | Default |
|---|---|---|---|
| Turbine ID | Turbine type | &turbineid=-1* | null |
| Power efficiency | Power efficiency of wind turbine | &power_efficiency=0.9 | 1 |
| Number of turbines | Number of turbines | &numberofturbines=10 | 1 |
| kWp** | Kilowatt peak production | &kwp=1 | 1 |
* You can find the list of the turbine IDs / types here.
** only applicable for standard turbine (turbineid=-1)
Package Content
| Variable | Units | Description | Intervals |
|---|---|---|---|
| Wind Power | kW | 80m above ground | 5, 10, 15, 20, 30 mins, 1h |
Package Specific Output Parameters
| Output parameters | Units | Description |
|---|---|---|
| Turbine Type | Type | Selected Turbine Type |
| kWp | kW | Peak capacity of wind turbine |
| Number of Turbines | # | Number of turbines |
| Forecast Type | - | RAW |
| Power efficiency | % | Power efficiency of wind turbine |
Advanced Packages
Sea
The Sea data package contains marine weather forecasts. The forecasts are only valid for locations located at least 20km away from the coast. Note also that, as the predictability drops severely for forecasts further than 5 days ahead, data for future periods beyond that may not always be available.
Example URL: https://my.meteoblue.com/packages/sea-1h_sea-day?lat=67.552&lon=4.222&apikey=DEMOKEY
Package Content
| Variable | Units | Description | Intervals | Aggregations (6h, day) |
|---|---|---|---|---|
| Significant wave height | m | Average of all waves, effective wave height (as would be observed, not average) | 1h, 3h, 6h, day | Min, max, mean |
| Wind wave direction | ° | Average for open sea, direction to which the waves move | 1h, 3h, 6h, day | Dominant |
| Sea surface temperature | °C, °F | Average for (open) sea, mean | 1h, 3h, 6h, day | Mean |
| Wind wave height | m | Highest 3 of wind waves | 1h, 3h, 6h, day | Min, max, mean |
| Mean wind wave period | s | Majority of waves | 1h, 3h, 6h, day | Min, max, mean |
| Mean wave direction | ° | Average of all waves, direction to which the waves move | 1h, 3h, 6h, day | Dominant |
| Mean wave period | s | Average of all waves | 1h, 3h, 6h, day | Min, max, mean |
| Significant height of swell waves | m | Highest waves average | 1h, 3h, 6h, day | Min, max, mean |
| Mean period of swell waves | s | Highest waves average | 1h, 3h, 6h, day | Min, max, mean |
| Peak wave period of swell waves | s | 1h, 3h, 6h, day | Min, max, mean | |
| Peak wave period of wind waves | s | 1h, 3h, 6h, day | Min, max, mean | |
| Mean direction of swell waves | ° | 1h, 3h, 6h, day | Dominant | |
| Current velocity U | m/s | Velocity on longitude-axis | 1h, 3h, 6h, day | Min, max, mean |
| Current velocity V | m/s | Velocity on latitude-axis | 1h, 3h, 6h, day | Min, max, mean |
| Salinity | PSA* | *Practical salinity unit | 1h, 3h, 6h, day | Mean |
| Douglas seastate | Classification of sea conditions based on observed wave height | 1h, 3h, 6h, day | Min, max, mean | |
| Surfwave height | m, ft | Vertical distance between the crest and trough of a wave in water | 1h, 3h, 6h, day | Min, max, mean |
| Wavesteepness | Ratio of wave's height to its wavelength | 1h, 3h, 6h, day | Min, max, mean | |
| Index to 1h values | Index | Corresponding hourly Index to daily values | day | start, end |
Air
The Air data package contains atmospheric forecasts like CAPE and lifted index.
Example URL: https://my.meteoblue.com/packages/air-1h_air-day?lat=47.558&lon=7.573&apikey=DEMOKEY
Package Content
| Variable | Units | Description | Intervals | Aggregations (6h, day) |
|---|---|---|---|---|
| CAPE | J/kg | Convective Available Potential Energy | 1h, 3h, 6h, day | Min, max, mean |
| Lifted index | J/kg | Risk of thunderstorms: Measure of atmospheric instability | 1h, 3h, 6h, day | Min, max, mean |
| Thunderstorm probability | % | Risk of thunderstorms: quantifies the chances of thunderstorm formation within a defined geographical area within a specified time frame | 1h, 3h, 6h, day | |
| Boundary layer height | m | Layer with inversion | 1h, 3h, 6h, day | Min, max, mean |
| Helicity | ms | Potential for helical flow | 1h, 3h, 6h, day | Min, max, mean |
| Convective inhibition | m | Measure of the unlikelihood of thunderstorm development | 1h, 3h, 6h, day | Min, max, mean |
| Cloud ice | g | Total atmospheric column frozen water content of all clouds, excluding precipitation, Total column (ground to top of atmosphere) | 1h, 3h, 6h, day | Min, max, mean |
| Cloud water | g | Total atmospheric column liquid water content of all clouds, excluding precipitation, Total column (ground to top of atmosphere) | 1h, 3h, 6h, day | Min, max, mean |
| Freezing level height | m | Zero-degree isotherm in the free atmosphere, above sea level | 1h, 3h, 6h, day | Min, max, mean |
| Windchill | °C, °F | Cooling effect of wind on the human perception of temperature | 1h, 3h, 6h, day | Min, max, mean |
| Heatindex | °C, °F | Assessment of temperature perceived by human body due to combined effects of heat and humidity | 1h, 3h, 6h, day | Min, max, mean |
| Wet-bulb globe temperature | °C, °F | Lowest temperature achievable through water evaporation | 1h, 3h, 6h, day | Min, max, mean |
| Convective cloud base pressure | hPa | Atmospheric pressure at cloud base of vertically developing clouds | 1h, 3h, 6h, day | Min, max, mean |
| Convective cloud top pressure | hPa | Atmospheric pressure at cloud top of vertically developing clouds | 1h, 3h, 6h, day | Min, max, mean |
| Convective updraft velocity | m/s | Velocity of rising air masses driven by convection | 1h, 3h, 6h, day | Min, max, mean |
| Index to 1h values | Index | Corresponding hourly Index to daily values | day | start, end |
Air Quality
The Air Quality data package contains air quality forecasts like pollutant concentrations. Within Europe, the resolution of the forecast is 12 km, which is very high for air quality purposes, however the forecast cannot capture local effects like pollution along a road in a city, where actual concentrations could be much higher. In such a case you should refer to very local measurements taken at the exact spot of interest.
Example URL: https://my.meteoblue.com/packages/airquality-1h_airquality-day?lat=47.558&lon=7.573&apikey=DEMOKEY
Package Content
| Variable | Units | Description | Intervals | Aggregations (day) |
|---|---|---|---|---|
| Ozone concentration | μg/m | 2m above ground | 1h, 3h, day | Min, max, mean |
| Dust concentration | μg/m | 2m above ground | 1h, 3h, day | Min, max, mean |
| PM2.5 concentration | μg/m | 2m above ground, particulate matter | 1h, 3h, day | Min, max, mean |
| PM10 concentration | μg/m | 2m above ground, particulate matter | 1h, 3h, day | Min, max, mean |
| SO concentration | μg/m | 2m above ground, sulphur dioxide | 1h, 3h, day | Min, max, mean |
| NO concentration | μg/m | 2m above ground, nitrogen dioxide | 1h, 3h, day | Min, max, mean |
| CO concentration | μg/m | 2m above ground, carbon monoxide | 1h, 3h, day | Min, max, mean |
| Birch pollen | μg/m | 2m above ground, Europe only | 1h, 3h, day | Min, max, mean |
| Grass pollen | μg/m | 2m above ground, Europe only | 1h, 3h, day | Min, max, mean |
| Olive pollen | μg/m | 2m above ground, Europe only | 1h, 3h, day | Min, max, mean |
| AOD550 concentration | μg/m | 2m above ground, aerosol optical depth at 550 nm | 1h, 3h, day | Min, max, mean |
| Air quality index | 0-100 | 2m above ground | 1h, 3h, day | Min, max, mean |
| Sandstorm alert | 0,1 | 2m above ground | 1h, 3h, day | |
| Index to 1h values | Index | Corresponding hourly Index to daily values | day | start, end |
Sigma Level
The Sigma Level data package contains atmospheric layer forecasts above 300m.
Example URL: https://my.meteoblue.com/packages/sigmalevel-1h_sigmalevel-day?lat=47.558&lon=7.573&sigmalevel=1200&apikey=DEMOKEY
Required Input Parameters
| Name | Description | Example | Default |
|---|---|---|---|
| Sigma level | Height above ground in [m] | &sigmalevel=1200 | null |
Package Content
| Variable | Units | Description | Intervals | Aggregations (day) |
|---|---|---|---|---|
| Temperature | °C, °F | 5, 10, 15, 20, 30 mins, 1h, 3h, day | Min, max, mean | |
| Air density | kg/m | As result of altitude, temperature and humidity | 1h, 3h, day | Min, max, mean |
| Relative humidity | % | Air humidity | 5, 10, 15, 20, 30 mins, 1h, 3h, day | Min, max, mean |
| Wind speed | m/s, km/h, kn, mph, bf | 5, 10, 15, 20, 30 mins, 1h, 3h, day | Min, max, mean | |
| Wind direction | °, 2 char, 3 char | 5, 10, 15, 20, 30 mins, 1h, 3h, day | Dominant |
Note: The Sigma Level package must not be used for heights less than 300m above ground, since such data would be heavily influenced by the surface. The highest available data layer is computed for 150mb (10 kilometers or more above ground).
Profile Series
Data for the following Profile Series are provided on different vertical levels. They are available in steps of 50mb for the pressure range of 150mb to 850mb, and steps of 25mb for the range of 850mb to 1000mb.
Profile Series Temperature
Example URL: https://my.meteoblue.com/packages/profiletemp-1h?lat=47.558&lon=7.573&apikey=DEMOKEY
| Variable | Units | Intervals |
|---|---|---|
| Temperature profile | °C, °F | 5, 10, 15, 20, 30 mins, 1h, 3h |
Profile Series Geopotential Height
Example URL: https://my.meteoblue.com/packages/profileheight-1h?lat=47.558&lon=7.573&apikey=DEMOKEY
| Variable | Units | Intervals |
|---|---|---|
| Geopotential height profile | gpm | 1h, 3h |
Profile Series Wind
Example URL: https://my.meteoblue.com/packages/profilewind-1h?lat=47.558&lon=7.573&apikey=DEMOKEY
| Variable | Units | Intervals |
|---|---|---|
| Wind speed profile | m/s, km/h, kn, mph, bf | 5, 10, 15, 20, 30 mins, 1h, 3h |
| Wind direction profile | °, 2 char, 3 char | 1h, 3h |
Profile Series Cloud Cover
Example URL: https://my.meteoblue.com/packages/multimodelcloudprofile-1h?lat=47.558&lon=7.573&asl=279&apikey=DEMOKEY
| Variable | Units | Description | Intervals |
|---|---|---|---|
| Cloud cover profile | % | Cover of the sky | 1h |
Note: This package is available with vertical levels from 1060 to 140 mb in 20 mb steps.
Profile Series Relative Humidity
Example URL: https://my.meteoblue.com/packages/profilerh-1h?lat=47.558&lon=7.573&apikey=DEMOKEY
| Variable | Units | Description | Intervals |
|---|---|---|---|
| Relative humidity profile | % | Air humidity | 5, 10, 15, 20, 30 mins, 1h, 3h |
Snow Ice
The Snow Ice package provides forecast data of "winter" precipitation types, snow and ice.
Example URL: https://my.meteoblue.com/packages/snowice-1h?lat=48&lon=8&asl=209&name=abcd&cache=no&apikey=DEMOKEY
Package Content
| Variable | Units | Description | Intervals |
|---|---|---|---|
| Freezingrain | mm | 1h | |
| Icing on surface | mm | 1h | |
| Icing on wire | mm | 1h | |
| Precipitationtype 0 | mm | No Precipitation | 1h |
| Precipitationtype 1 | mm | Rain | 1h |
| Precipitationtype 2 | mm | Snow | 1h |
| Precipitationtype 3 | mm | Rain Snow Mix | 1h |
| Precipitationtype 4 | mm | Sleet | 1h |
| Precipitationtype 5 | mm | Freezing Rain | 1h |
| Precipitationtype 6 | mm | Frozen Mix | 1h |
| Precipitationtype probability freezingrain | % | 1h | |
| Precipitationtype probability icepellets | % | 1h | |
| Precipitationtype probability rain | % | 1h | |
| Precipitationtype probability snow | % | 1h | |
| Snowaccumulation | mm | 1h | |
| Snowdepth | m | 1h | |
| Snowmelt | mm | 1h |
Ensemble and Probabilistic Forecasting Packages
Overview of Ensemble and Probabilistic Forecasting Data Packages:
| trend-day , trend-1h , trendpro-day | multimodel-1h | ensemble-1h | |
|---|---|---|---|
| Type of forecast | Consensus or most likely forecast. Has downscaling and bias corrections | Raw model data from high resolu-tion models | Downscaled, bias corrected en-semble members |
| Models used | Ensemble members, high resolution models | High resolution models | GFS-ensemble |
| Probabilistic information | Spread, overall predictability | Individual highresolution models | Individual ensemble members and control forecast |
| Forecast horizon | 14 days | Up to 7 days | 14 days |
| Important restrictions | Raw model data, no bias correction or other improvements done to forecast. Variable number of models and forecast horizons depending on location and model. Not a true ensemble, thus some members might provide better forecast under certain weather conditions, depending on the location. | Variability in the first 5 days not accurately captured, use multimodel if first 5 days are main focus. Accuracy for first 7 days not competitive with other packages. 1h data is for technical simplification only, there is no skill in 1h 14 day forecasts. Not available in CSV format. |
If you are looking for the best possible 7 day forecast and are not interested in details about forecast uncertainties of different weather variables, none of these packages should be used.
To access the most accurate short-term forecast, do not use the multimodel or ensemble forecast data packages. The basic data package always uses the highest resolution model available for the selected location and is updated with local measurements and observational data (if available) and therefore, this data package is more suitable for short-term forecasts.
The trend data packages deliver the same forecast data than in the standard data package for 7 forecast days (180 hours). For the remaining days (forecast days 8 – 14), you get trend data.
The trend data packages deliver the same forecast data than in the standard data package for 7 forecast days (180 hours). For the remaining days (forecast days 8 – 14), you get trend data. 1h data is for technical simplification only, there is no skill in 1h 14 day forecasts.
This raw model data is consistent with history-data. If you train your own AI-model based on history data, this is the package you need to use for forecasts.
The spread - defined as 1 standard deviation (StD) from the mean of the different model predictions - may be used to roughly estimate a 95% confidence interval, by adding / subtracting twice the variable spread to the variable value.
Multimodel Packages
Package Specific Output Parameters (for all Multimodels)
| Output parameters | Units | Description |
|---|---|---|
| Grid point elevation | m | Meters above sea level of model specific grid center |
Multimodel
The Multimodel data package contains raw model output for all models available for the selected location, without any post-processing, down-scaling or corrections.
Example URL: https://my.meteoblue.com/packages/multimodel-1h_multimodel-3h?lat=47.558&lon=7.573&apikey=DEMOKEY
Package Content
| Variable | Units | Description | Intervals |
|---|---|---|---|
| Temperature | °C, °F | 5, 10, 15, 20, 30 mins, 1h, 3h | |
| Wind speed | km/h, m/s, knots, bf, mph | 5, 10, 15, 20, 30 mins, 1h, 3h | |
| Wind direction | °, 2 char, 3 char | 5, 10, 15, 20, 30 mins, 1h, 3h | |
| Precipitation | mm, inch | Water amount | 5, 10, 15, 20, 30 mins, 1h, 3h |
| Cloud cover | % | Cover of the sky | 1h, 3h |
| Temperature spread | °C, °F | 1 StD from the multimodel mean | 1h, 3h |
| Wind speed spread | km/h, m/s, knots, bf, mph | 1 StD from the multimodel mean | 1h, 3h |
| GHI (Shortwave radiation) | W/m | Global horizontal radiation | 1h, 3h |
Note: The number of models may change between locations and even days, depending on availability: There are no guarantees of delivery of any particular model or of the timing on the update of any particular model for a given place or day. Models may be removed in the future or others may be added.
No quality control of any kind is performed on third party models included in this package. The main purpose of using the multimodel package is to determine a degree of uncertainty from the different model outputs, to compare models, to derive algorithms for selecting the best fit data and to store data for documentation purposes.
Restriction: The Multimodel data package is not available in CSV format.
Single Variable Multimodel
The Single Variable Multimodel data packages contain hourly data from all available models for specific variables. A true multimodel package contains low and high resolution models (able to detect more local weather phenomenon), with some models delivering better forecasts than others, depending on location, variable and weather condition. It therefore can reproduce the uncertainities in the weather forcast for the next 3 to 5 days much better than an ensemble package, that tends to overestimate the confidence in the foreast.
When using the Single Variable Multimodel packages, make sure that your code can cope with the following:
- at any time, without any prior notice, a model could disappear from the package (e.g. because some agency decides that a particular model will not be continued or data will not be shared anymore).
- at any time, without any prior notice, a new model could be added to the package.
Note: Next to the raw data from all available models, these packages also deliver min, max, mean, stdv as well as p95- / p90- / … / p15- / p10-exceedence data.
Restriction: The single variable multimodel packages can not be combined with other hourly data packages in the same call.
Multimodel Temperature
Example URL: https://my.meteoblue.com/packages/multimodeltemperature-1h?lat=47.558&lon=7.573&apikey=DEMOKEY
| Variable | Units | Intervals |
|---|---|---|
| Temperature | °C, °F | 5, 10, 15, 20, 30 mins, 1h |
Multimodel Precipitation
Example URL: https://my.meteoblue.com/packages/multimodelprecipitation-1h?lat=47.558&lon=7.573&apikey=DEMOKEY
| Variable | Units | Description | Intervals |
|---|---|---|---|
| Precipitation | mm, inch | Water amount | 5, 10, 15, 20, 30 mins, 1h |
Multimodel Relative Humidity
Example URL: https://my.meteoblue.com/packages/multimodelrh-1h?lat=47.558&lon=7.573&apikey=DEMOKEY
| Variable | Units | Description | Intervals |
|---|---|---|---|
| Relative Humidity | % | Air humidity | 5, 10, 15, 20, 30 mins, 1h |
Multimodel Wind Speed
Example URL: https://my.meteoblue.com/packages/multimodelwind-1h?lat=47.558&lon=7.573&apikey=DEMOKEY
| Variable | Units | Intervals |
|---|---|---|
| Wind speed | km/h, m/s, knots, bf, mph | 5, 10, 15, 20, 30 mins, 1h |
Multimodel Wind Speed 80m
Example URL: https://my.meteoblue.com/packages/multimodelwind80-1h?lat=47.558&lon=7.573&apikey=DEMOKEY
| Variable | Units | Intervals |
|---|---|---|
| Wind speed (80m) | km/h, m/s, knots, bf, mph | 5, 10, 15, 20, 30 mins, 1h |
Multimodel Wind Direction
Example URL: https://my.meteoblue.com/packages/multimodelwinddirection-1h?lat=47.558&lon=7.573&asl=279&format=json&apikey=DEMOKEY
| Variable | Units | Intervals |
|---|---|---|
| Wind direction | ° | 5, 10, 15, 20, 30 mins, 1h |
Multimodel Wind Direction 80m
| Variable | Units | Intervals |
|---|---|---|
| Wind direction (80m) | ° | 5, 10, 15, 20, 30 mins, 1h |
Multimodel Wind Power
Required Input Parameters
| Name | Description | Example | Default |
|---|---|---|---|
| Turbine ID | Turbine type | &turbineid=-1* | null |
| Power efficiency | Power efficiency of wind turbine | &power_efficiency=0.9 | 1 |
| Number of turbines | Number of turbines | &numberofturbines=10 | 1 |
| kWp** | Kilowatt peak production | &kwp=1 | 1 |
* You can find the list of the turbine IDs / types here.
** only applicable for standard turbine (turbineid=-1)
Package Content
| Variable | Units | Intervals |
|---|---|---|
| Wind power | kW | 5, 10, 15, 20, 30 mins, 1h |
Multimodel Clouds
Example URL: https://my.meteoblue.com/packages/multimodelclouds-1h?lat=47.558&lon=7.573&apikey=DEMOKEY
| Variable | Units | Description | Intervals |
|---|---|---|---|
| Clouds | % | Cover of the sky | 5, 10, 15, 20, 30 mins, 1h |
Multimodel Radiation
Example URL: https://my.meteoblue.com/packages/multimodelradiation-1h?lat=47.558&lon=7.573&apikey=DEMOKEY
| Variable | Units | Description | Intervals |
|---|---|---|---|
| Shortwave radiation | W/m | Backwards average | 5, 10, 15, 20, 30 mins, 1h |
Multimodel PV
Required Input Parameters
| Name | Description | Example | Default |
|---|---|---|---|
| kWp | Kilowatt peak production | &kwp=1 | null |
| Slope | Inclination of solar panel | &slope=20 | null |
| Facing | Orientation of solar panel | &facing=180 | null |
| Power efficiency | Power efficiency of pv module | &power_efficiency=0.9 | 0.85 |
| Tracker* | For solar panels using a sun tracker | &tracker=1 | null |
*Sun tracker definition
| Mode | Description |
|---|---|
| 1 | Daily-1-axis-tracker |
| 2 | 2-axis-tracker |
| 3 | Yearly-1-axis-tracker |
| 4 | DNI-tracker |
| 5 | Daily-1-axis-slope-tracker |
Package Content
| Variable | Units | Description | Intervals |
|---|---|---|---|
| PV power | kWh, mW/h | Photovoltaic power | 5, 10, 15, 20, 30 mins, 1h |
14-Day Forecast Packages
For the following trend data packages, we guarantee weather forecast data for 14 days (336h). However, forecast data for 384h may be available and delivered. It therefore is suggested that the API automation is implemented with the required flexibility, if the full available extend of the forecast is to be used.
Ensemble
The Ensemble data package contains all individual members of the GFS ensemble forecast. Ensemble data are down-scaled and bias corrected to higher spatial resolution and to 1h temporal resolution. The 1h time resolution is provided to simplify automatic processing, but it has to be clearly noted that it is impossible to have skilful 14-day forecasts at 1h time resolution. The control member is the forecast based on the original analysis; the 20 members are the forecasts resulting from the perturbation of the initial conditions. There is no best member, every member has the same probability of being correct or wrong. This data package is intended for professional customers who are familiar with ensemble forecasting and want to derive their own risk analysis for 5 to 14 days into the future.
Example URL: https://my.meteoblue.com/packages/ensemble-1h?lat=47.558&lon=7.573&apikey=DEMOKEY
Package Content
| Variable | Units | Description | Intervals | Ensemble |
|---|---|---|---|---|
| Temperature | °C, °F | 2m above ground | 1h | GFS, ECMWF |
| Skin / Surface temperature | °C, °F | Soil surface or skin | 1h | GFS |
| Wind speed | m/s, km/h, kn, mph, bf | 10m above ground | 1h | GFS, ECMWF |
| Wind direction | °, 2 char, 3 char | 10m above ground | 1h | GFS, ECMWF |
| Wind gusts | m/s, km/h, kn, mph, bf | 10m above ground | 1h | GFS |
| Precipitation | mm, inch | Water amount | 1h | GFS, ECMWF |
| Low clouds | % | Cover of the sky | 1h | GFS |
| Mid clouds | % | Cover of the sky | 1h | GFS |
| High clouds | % | Cover of the sky | 1h | GFS |
| GHI (Solar radiation) | W/m | Global horizontal radiation (backwards) | 1h | GFS |
Package Specific Output Parameters
| Output parameters | Units | Description |
|---|---|---|
| ECMWF ensemble members | - | List of the ensemble members and cntl = avrage over all of them |
| GFS ensemble members | - | List of the ensemble members and cntl = avrage over all of them |
Restriction: The multimodel data-package is not available in CSV format.
Trend
The Trend package contains 14-day ensemble forecasts for the most common weather variables.
Example URL: https://my.meteoblue.com/packages/trend-1h_trend-day?lat=47.558&lon=7.573&apikey=DEMOKEY
Package Content
| Variable | Units | Description | Intervals | Aggregations (day) |
|---|---|---|---|---|
| Temperature | °C, °F | 2m above ground | 1h, day | Min, max, mean |
| Temperature spread | °C, °F | 2m above ground, 1 StD from the mean temperature | 1h, day | |
| Precipitation | mm, inch | Water amount | 1h, day | Sum |
| Precipitation spread | mm, inch | Water amount, 1 StD from the mean precipitation | 1h, day | |
| Precipitation probability | % | day | ||
| Predictability | % | day | ||
| Predictability class | 0 - 5 | 0 = very low, 5 = very high | day | |
| Wind speed | m/s, km/h, kn, mph, bf | 10m above ground | 1h, day | Min, max, mean |
| Wind speed spread | m/s, km/h, kn, mph, bf | 10m above ground, 1 StD from the mean wind speed | 1h, day | |
| Wind direction | °, 2 char, 3 char | 10m above ground | 1h, day | Dominant |
| Sea level pressure | hPa | Corrected for sea level | 1h, day | Min, max, mean |
| Relative humidity | % | Air humidity | 1h, day | Min, max, mean |
| Total cloud cover | % | Cover of the sky, Analogue to METAR 0 - 8 | 1h, day | Min, max, mean |
| Total cloud cover spread | % | Cover of the sky, 1 StD from the mean cloud cover | 1h, day | |
| Snow fraction | 0, 1 | information whether precipitation falls as rain or snow: 0 = rain, 1 = snow | 1h, day | Hourly: 0 or 1, aggregations: range from 0 till 1 (mean of hourly values) |
| Pictocode | 1 - 35, 1 - 17 | 1h: 1 - 35 day/night pictos, day: 1 - 17 iday pictos | 1h, day | |
| GHI backwards | W/m Wh/m | Global Horizontal Radiation | 1h, day | Sum |
| Extraterrestrial radiation backwards | W/m Wh/m | Extraterrestrial solar radiation | 1h, day | Sum |
| Isdaylight | 0, 1 | 1 = day, 0 = night | 1h |
Trend Pro
The Trend Pro data package contains 14-day ensemble forecasts for a large variety of weather variables. It offers additonal variables compared to the regular trend package.
Example URL: https://my.meteoblue.com/packages/trendpro-1h_trendpro-day?lat=47.558&lon=7.573&apikey=DEMOKEY
Package Content
| Variable | Units | Description | Intervals | Aggregations (day) |
|---|---|---|---|---|
| Temperature | °C, °F | 2m above ground | 1h, day | Min, max, mean |
| Temperature spread | °C, °F | 2m above ground, 1 StD from the mean temperature | 1h, day | |
| Felttemperature | °C, °F | 1h, day | Min, max, mean | |
| Precipitation | mm, inch | Water amount | 1h, day | Sum |
| Precipitation spread | mm, inch | 1 StD from the mean precipitation | 1h, day | |
| Precipitation probability | % | 1h, day | ||
| Wind speed | m/s, km/h, kn, mph, bf | 10m above ground | 1h, day | Min, max, mean |
| Wind speed spread | m/s, km/h, kn, mph, bf | 10m above ground, 1 StD from the mean wind speed | 1h, day | |
| Wind gusts | m/skm/h, kn, mph, bf | 10m above ground, 1 StD from the mean wind gust | 1h, day | Min, max, mean |
| Wind direction | °, 2 char, 3 char | 10m above ground | 1h, day | Dominant |
| Sea level pressure | hPa | Corrected for sea level | 1h, day | Min, max, mean |
| Relative humidity | % | Air humidity | 1h, day | Min, max, mean |
| Total evapotranspiration* | mm, inch | 1h, day | Sum | |
| Reference evapotranspiration* (ET_0) | mm, inch | 1h, day | Sum | |
| Total cloud cover | % | Cloud cover, Cover of the sky | 1h, day | Min, max, mean |
| Total cloud cover spread | % | Cover of the sky, 1 StD from the mean cloud cover | 1h, day | |
| Snow fraction | 0, 1 | information whether precipitation falls as rain or snow: 0 = rain, 1 = snow | 1h, day | Hourly: 0 or 1, aggregations: range from 0 till 1 (mean of hourly values) |
| Pictocode | 1 - 35, 1 - 17 | 1h: 1 - 35 day/night pictos, day: 1 - 17 iday pictos | 1h, day | |
| Low clouds | % | Cloud cover, Cover of the sky | 1h, day | Min, max, mean |
| Mid clouds | % | Cloud cover, Cover of the sky | 1h, day | Min, max, mean |
| High clouds | % | Cloud cover, Cover of the sky | 1h, day | Min, max, mean |
| Sunshine time | min/h | Direct sunlight, Depends also on day length | 1h, day | min/Interval |
| Visibility | km | Distance | 1h, day | Min, max, mean |
| Skin/ Surface temperature | °C, °F | Soil surface or skin | 1h, day | Min, max, mean |
| Dew point temperature | °C, °F | 2m above ground | 1h, day | Min, max, mean |
| CAPE | 1h, day | Min, max, mean | ||
| Predictability | % | day | ||
| Predictability class | 0 - 5 | 0 = very low, 5 = very high | day | |
| GHI backwards | W/m Wh/m | Global horizontal radiation | 1h, day | Sum |
| Extraterrestrial radiation backwards | W/m Wh/m | Extraterrestrial solar radiation | 1h, day | Sum |
| Isdaylight | 0, 1 | 1 = day, 0 = night | 1h | |
| UV Index | 0 - 11+ | Ground level | day | |
| Lifted index | J/kg | Risk of thunderstorms: Measure of atmospheric instability | 1h, day | Min, max, mean |
* For further information about the different evapotranspiration datasets, please consult the variable documentation.
Long Term Forecasts
Weekly Subseasonal Anomaly
The calibrated seasonal and subseasonal forecast package contains information for calibrated long-range forecasts in the subseasonal (i.e., weeks ahead) and seasonal (i.e., months and seasons ahead) for the next six months. Our long-range forecast partner, the World Climate Service, provides these forecasts.
The package contains forecasts from NOAA’s Climate Forecast System Version 2 (CFSv2) seasonal forecast model, the European Centre for Medium-Range Weather Forecasts SEAS5 seasonal forecast model, and a proprietary multi-model ensemble (MME).
The forecasts are probabilistic tercile forecasts of each variable. Tercile forecasts predict the likelihood of future conditions being in the upper 33.3%, the middle 33.3%, and the lower 33.3% of the observed condition distribution. These categories are below normal (B), normal (N), and above normal (A).
The forecasts have been calibrated to be reliable, meaning the forecast condition should occur with the frequency with which they are forecasted. In other words, an above-normal temperature forecast of 60% for two months ahead will occur 60% of the time it’s forecasted. Forecast reliability is achieved via a data-intensive process called calibration, in which the performance of many years of reforecast data from the same forecast model is analyzed.
Example URL: https://my.meteoblue.com/packages/subseasonalanomaly-weekly?lat=40.0&lon=-50.0153&asl=8&&apikey=DEMOKEY
Package Content
| Variable | Units |
|---|---|
| coolingdegreedays_meananomaly | CDD |
| coolingdegreedays_meananomaly_trend | CDD |
| coolingdegreedays_probability_above_average | % |
| coolingdegreedays_probability_above_average_trend | % |
| coolingdegreedays_probability_below_average | % |
| coolingdegreedays_probability_below_average_trend | % |
| coolingdegreedays_probability_near_normal | % |
| coolingdegreedays_probability_near_normal_trend | % |
| geopotentialheight_500mb_meananomaly | m |
| geopotentialheight_500mb_meananomaly_trend | m |
| geopotentialheight_500mb_probability_above_average | % |
| geopotentialheight_500mb_probability_above_average_trend | % |
| geopotentialheight_500mb_probability_below_average | % |
| geopotentialheight_500mb_probability_below_average_trend | % |
| geopotentialheight_500mb_probability_near_normal | % |
| geopotentialheight_500mb_probability_near_normal_trend | % |
| heatingdegreedays_meananomaly | HDD |
| heatingdegreedays_meananomaly_trend | HDD |
| heatingdegreedays_probability_above_average | % |
| heatingdegreedays_probability_above_average_trend | % |
| heatingdegreedays_probability_below_average | % |
| heatingdegreedays_probability_below_average_trend | % |
| heatingdegreedays_probability_near_normal | % |
| heatingdegreedays_probability_near_normal_trend | % |
| precipitation_probability_above_average | % |
| precipitation_probability_below_average | % |
| precipitation_probability_near_normal | % |
| precipitationanomaly_percentage_from_normal | % |
| sealevelpressure_meananomaly | hPa |
| sealevelpressure_probability_above_average | % |
| sealevelpressure_probability_below_average | % |
| sealevelpressure_probability_near_normal | % |
| shortwaveradiation_meananomaly | W/m2 |
| shortwaveradiation_probability_above_average | % |
| shortwaveradiation_probability_below_average | % |
| shortwaveradiation_probability_near_normal | % |
| temperature_meananomaly | C° |
| temperature_meananomaly_trend | C° |
| temperature_probability_above_average | % |
| temperature_probability_above_average_trend | % |
| temperature_probability_below_average | % |
| temperature_probability_below_average_trend | % |
| temperature_probability_near_normal | % |
| temperature_probability_near_normal_trend | % |
| windspeed_meananomaly | m/s |
| windspeed_probability_above_average | % |
| windspeed_probability_below_average | % |
| windspeed_probability_near_normal | % |
Please refer to the following table for an explanation of the variable types:
| Content | Description |
|---|---|
| Probability below average | The probability that the selected variable will be in the lower 33.3% of the observed distribution from 1991 to 2020. |
| Probability near normal | The probability that the selected variable will be in the middle 33.3% of the observed distribution from 1991 to 2020. |
| Probability above average | The probability that the selected variable will be in the upper 33.3% of the observed distribution from 1991 to 2020. |
| Mean anomaly | Deviation from the weekly mean |
| Trend | The 'trend' involves eliminating the observed temperature trend before calibrating the forecasts. By removing the trend, the signal of the forecast model is highlighted more clearly, distinct from the underlying temperature trends. |
Seasonal Anomalies Forecast
The Season Anomalies Forecast package contains all relevant information for trend forecasts of seasonal anomalies for the next 6 months. This package contains monthly seasonal forecast anomalies from different models as well as a super-ensemble (SA-ENSEMBLE) created by meteoblue, which is a mean based on over 300 individual forecasts from different forecast centers and is more likely to be true than any single model.
The package also contains the mean climate reference from the seasonal ECMWF forecast, to which the according ECMWF seasonal anomalies may be applied to. Please be aware that the main purpose of the package is to forecast a rough trend, and that the difference in the climate references from the different models may be much larger than the individual or aggregated trends.
Example URL: https://my.meteoblue.com/packages/seasonalanomaly-monthly?lat=47.558&lon=7.573&apikey=DEMOKEY
Package Content
| Variable | Units |
|---|---|
| Temperature | °C, °F |
| Precipitation | mm |
| Sea surface temperature | °C, °F |
| Sea level pressure | hPa |
| Snow depth | m |
| Evapotranspiration | mm |
| Dew point temperature | °C, °F |
| Wind speed | m/s, km/h, kn, mph, bf |
| Total cloud cover | % |
Notes:
- Each model updates once a month. However, as the forecasts come from different centers, each model does so at a different time during the month. The initialization time of each model is shown in the modelrun_utc metadata.
- Not all models provide forecasts for all variables.
- If you implement this package be aware that more models or variables could be added in the future if they become available.
For further information about the various models see here.